
Call Center Report
Call Center Report
Section titled “Call Center Report”Analysis results answer questions about one call. The Call Center Report answers questions about your whole operation: how compliance is trending, which criterion agents fail most often, why customers call, and how the night shift compares with the day shift.
Open it from Call Center Report in the left navigation.
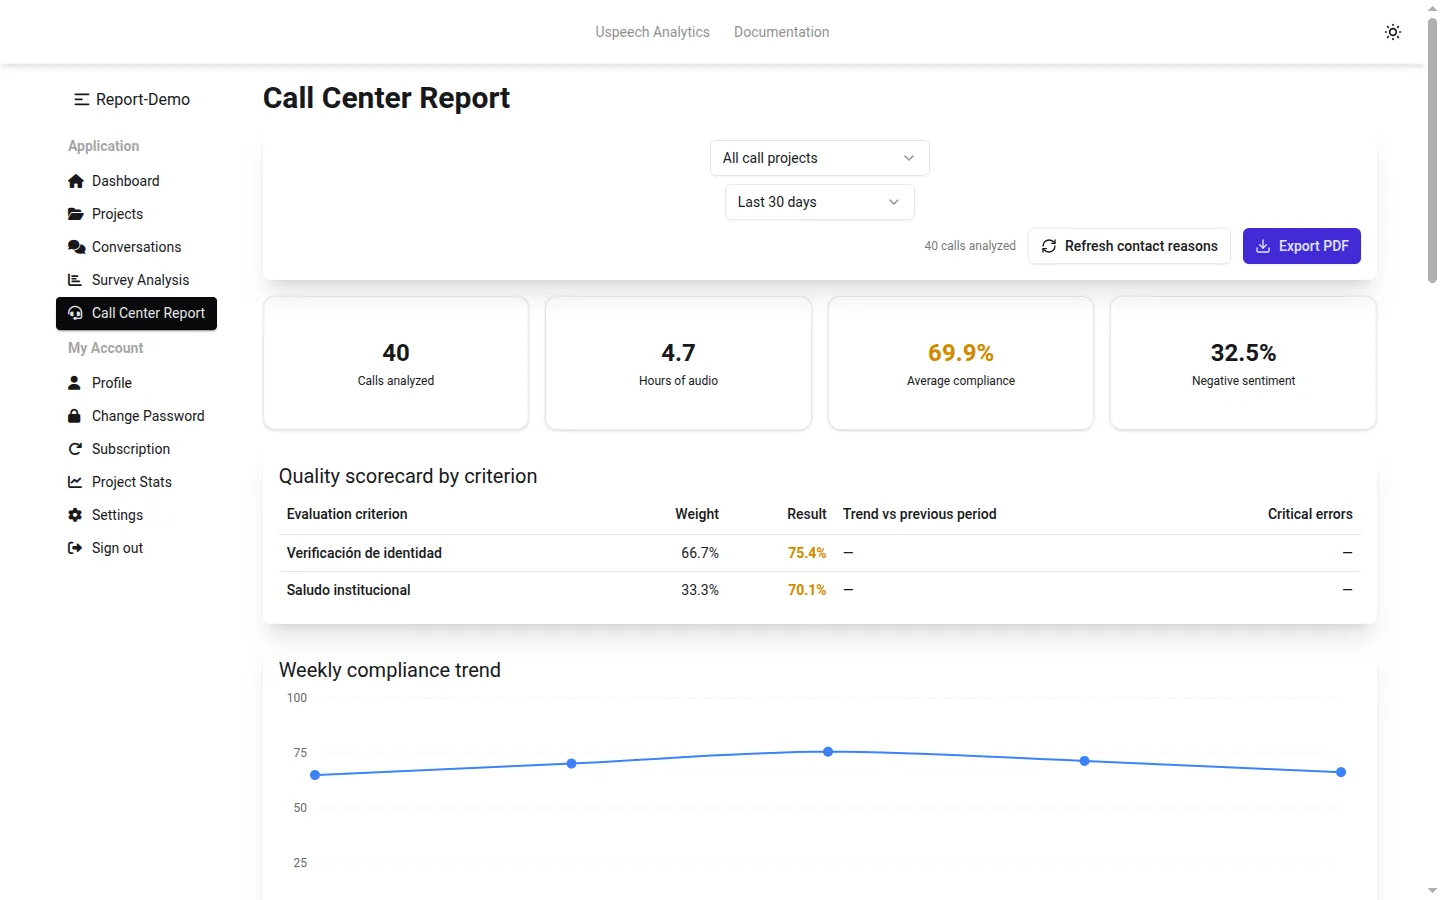
The report covers every analyzed call, no matter which analysis run produced it — a manual run over 500 recordings and a batch analyzed automatically on arrival feed the same dashboard.
Filters
Section titled “Filters”| Filter | Options |
|---|---|
| Project | All call projects, or a single one |
| Date range | Month to date, last month, last 30 days, last 90 days, year to date, all time, or a custom range |
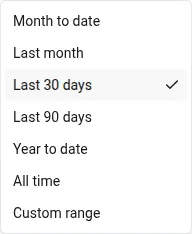
Dates filter on the call date/time, which comes from your call metadata. Calls without metadata fall back to their upload time.
While calls are being analyzed automatically, the header shows Analyzing new calls… and the dashboard refreshes as results land. Otherwise it shows how many calls have been analyzed in total.
A second figure — N duplicate uploads ignored — appears when a file was uploaded again under a name the project already had. Those count as the same call rather than inflating the totals.
Headline metrics
Section titled “Headline metrics”| Metric | How it is calculated |
|---|---|
| Calls analyzed | Number of analyzed calls in the range |
| Hours of audio | Total duration of those calls |
| Average compliance | Mean COPC score across the calls that were scored |
| Negative sentiment | Share of calls with negative sentiment, among calls where sentiment was determined |
A note appears when some calls have no client-provided date/time, telling you how many — those calls are placed by upload time in the trend and are excluded from the shift comparison.
Quality scorecard by criterion
Section titled “Quality scorecard by criterion”Average result per rubric criterion across all scored calls.
| Column | Meaning |
|---|---|
| Evaluation criterion | Criterion name from the rubric |
| Weight | The criterion’s share of the total available points |
| Result | Average score, as a percentage of the criterion’s maximum |
| Trend vs previous period | Change in percentage points against the immediately preceding window of the same length |
| Critical errors | Number of calls that triggered a critical error on this criterion |
When the project has an evaluation rubric attached, criteria are listed in rubric order. The trend column stays empty for the all time range and for custom ranges with no comparable previous window.
Weekly compliance trend
Section titled “Weekly compliance trend”Compliance and negative sentiment bucketed by week, so a drift shows up before it becomes a quarterly problem.
Contact reasons
Section titled “Contact reasons”Why customers called, with each reason’s share of volume. The top eight reasons are listed; everything else is grouped into Other.
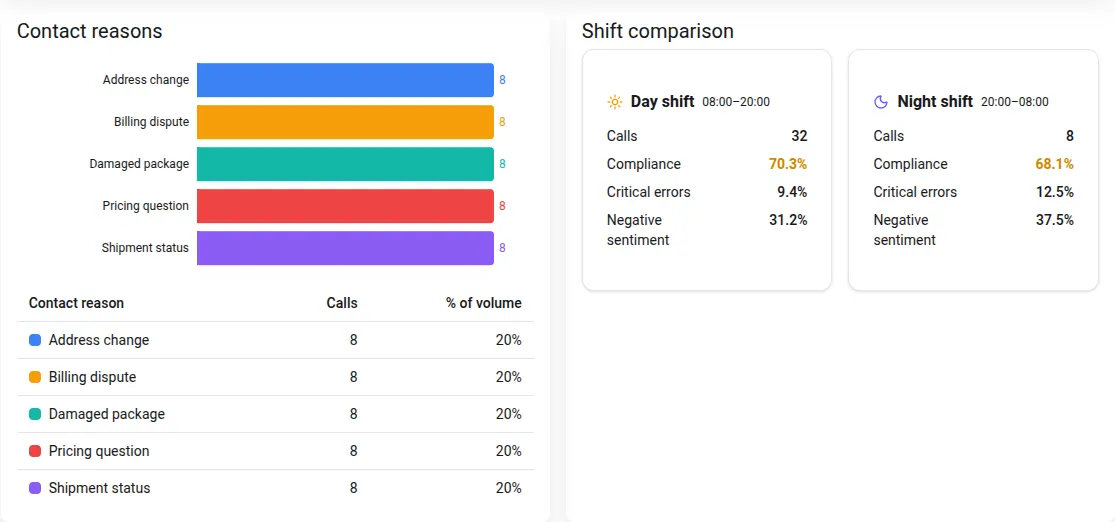
Reasons are categories, not raw text. Uspeech groups the free-text topic extracted from each call into a manageable set of contact reasons — otherwise 600 calls would produce 600 unique topics.
- Projects using frozen predefined codes classify every call against those codes as it is analyzed
- Projects with open-ended categories are re-grouped on a daily sweep, or immediately when you press Refresh contact reasons
Between re-groupings, calls that have not been classified yet appear under their raw topic, so nothing goes missing from the report.
Shift comparison
Section titled “Shift comparison”Day shift versus night shift, each with calls, compliance, critical errors and negative sentiment. The day shift is 08:00–20:00 by default.
Only calls with a real call date/time are classified — a call placed by upload time could land in the wrong shift, so it is left out rather than counted incorrectly. This is another reason to upload a CSV manifest.
Agent performance
Section titled “Agent performance”Per-agent rollup: calls, compliance, critical errors, negative sentiment and goal-reached rate. Every column is sortable, so “who needs coaching first” is one click away.

Agents come from the agent_id / agent_name in your call metadata, falling back to the name the AI extracted from the conversation.
A browser over every analyzed call, independent of which analysis run produced it.
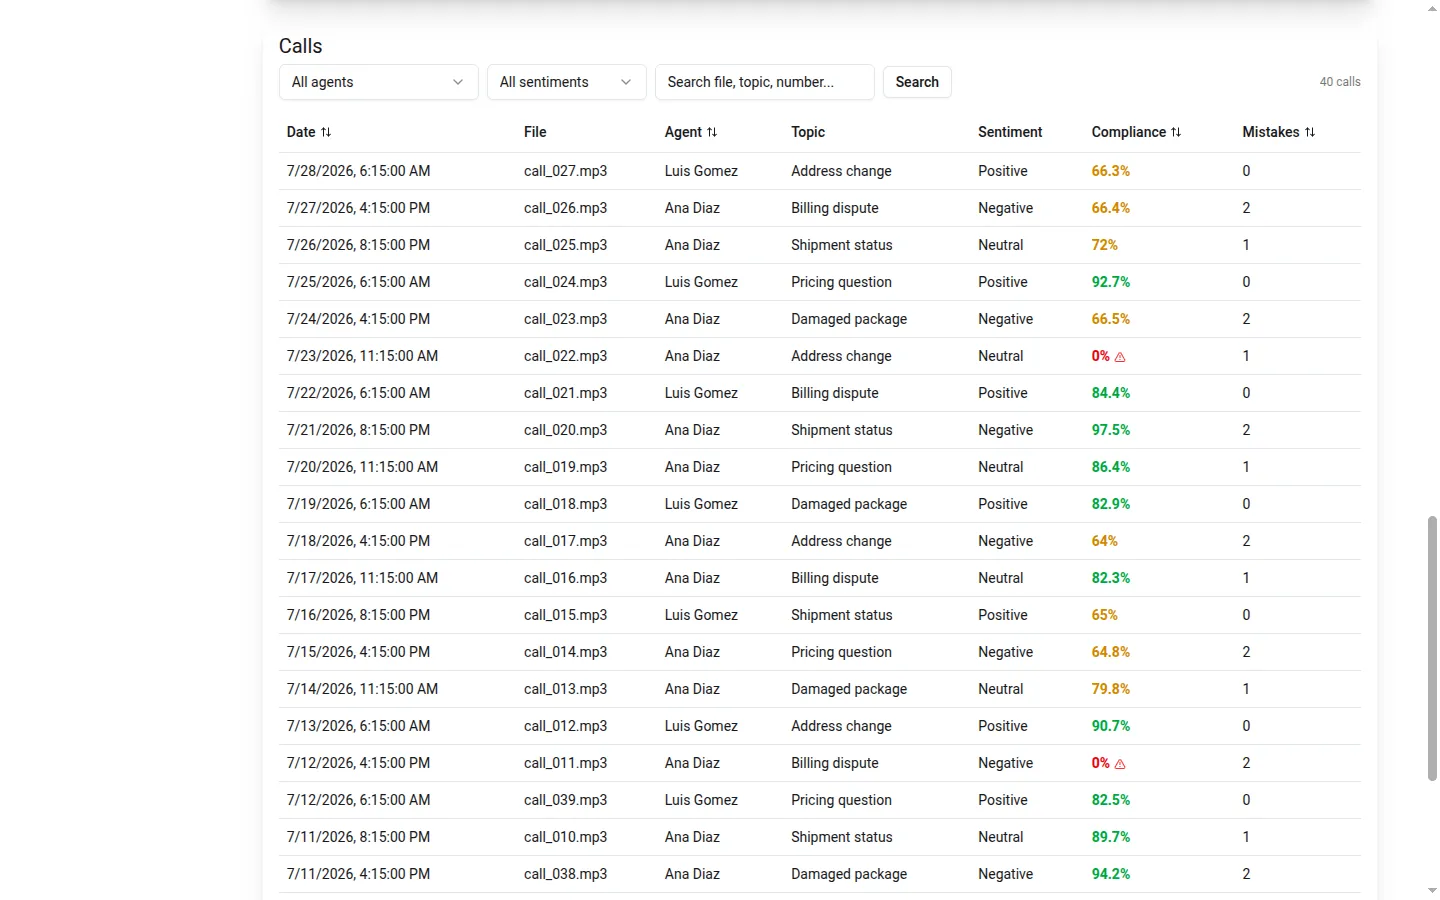
- Filters — agent (including (unassigned)), sentiment, plus the report’s project and date filters
- Search — file name, topic, caller number or campaign
- Sorting — date, agent, compliance and mistakes
- Pagination — 25 calls per page
Click any row to open the full detail of that call: criterion-by-criterion scores with the AI’s justification and the supporting quote, mistakes and missing protocol steps, custom-question answers, and links from each quote into the transcript.
Custom question answers
Section titled “Custom question answers”If the project answers custom questions on each call, an extra panel lists the answers per call, with one column per question. It appears only when answers exist.
Export PDF
Section titled “Export PDF”Export PDF produces a client-ready report for the current filters, containing:
- Cover metrics — calls analyzed, coverage, hours processed, average compliance
- Executive summary, key findings and prioritized recommendations
- Quality scorecard with a weighted overall compliance row and a short observation per criterion
- Contact reasons with a signal note per reason
- Agent performance with a coaching priority per agent
- A methodology and confidentiality note
The narrative sections are generated by AI from the aggregated numbers only — it has no access to transcripts and never invents quotes or causes. If narrative generation fails, the PDF is still produced with the tables and a note that insights are unavailable.